Understanding sea ice break-ups and their consequences

Sea ice cracks and break-ups appear due to storms and strong winds. It is a naturally occurring phenomenon, but is it getting worse due to climate change? And what about its consequences? Dig into how much is currently understood and into the most recent research within the Digital Twin Ocean precursor project about this topic in an interactive story.

Two important parameters to take into account when studying sea ice break-ups are sea ice extent and sea ice thickness. Both of them are changing rapidly due to climate change. The latter can be related to break-up events.

We have seen sea ice decline in both extent and thickness for the last few decades1. A quick comparison between 2000 and 2019 summers shows this apparent consequence of climate change.

This was the sea ice concentration, in which we can appreciate the extent, at the end of the summer in 2019.

And this was back in 2000. Notice how the difference between two decades is already largely visible.

On the other hand, the decline in sea ice thickness increases the probability of break-ups and cracks opening during storms or periods with strong winds. This is due to a larger mobility and weakness of the ice layers.2 3

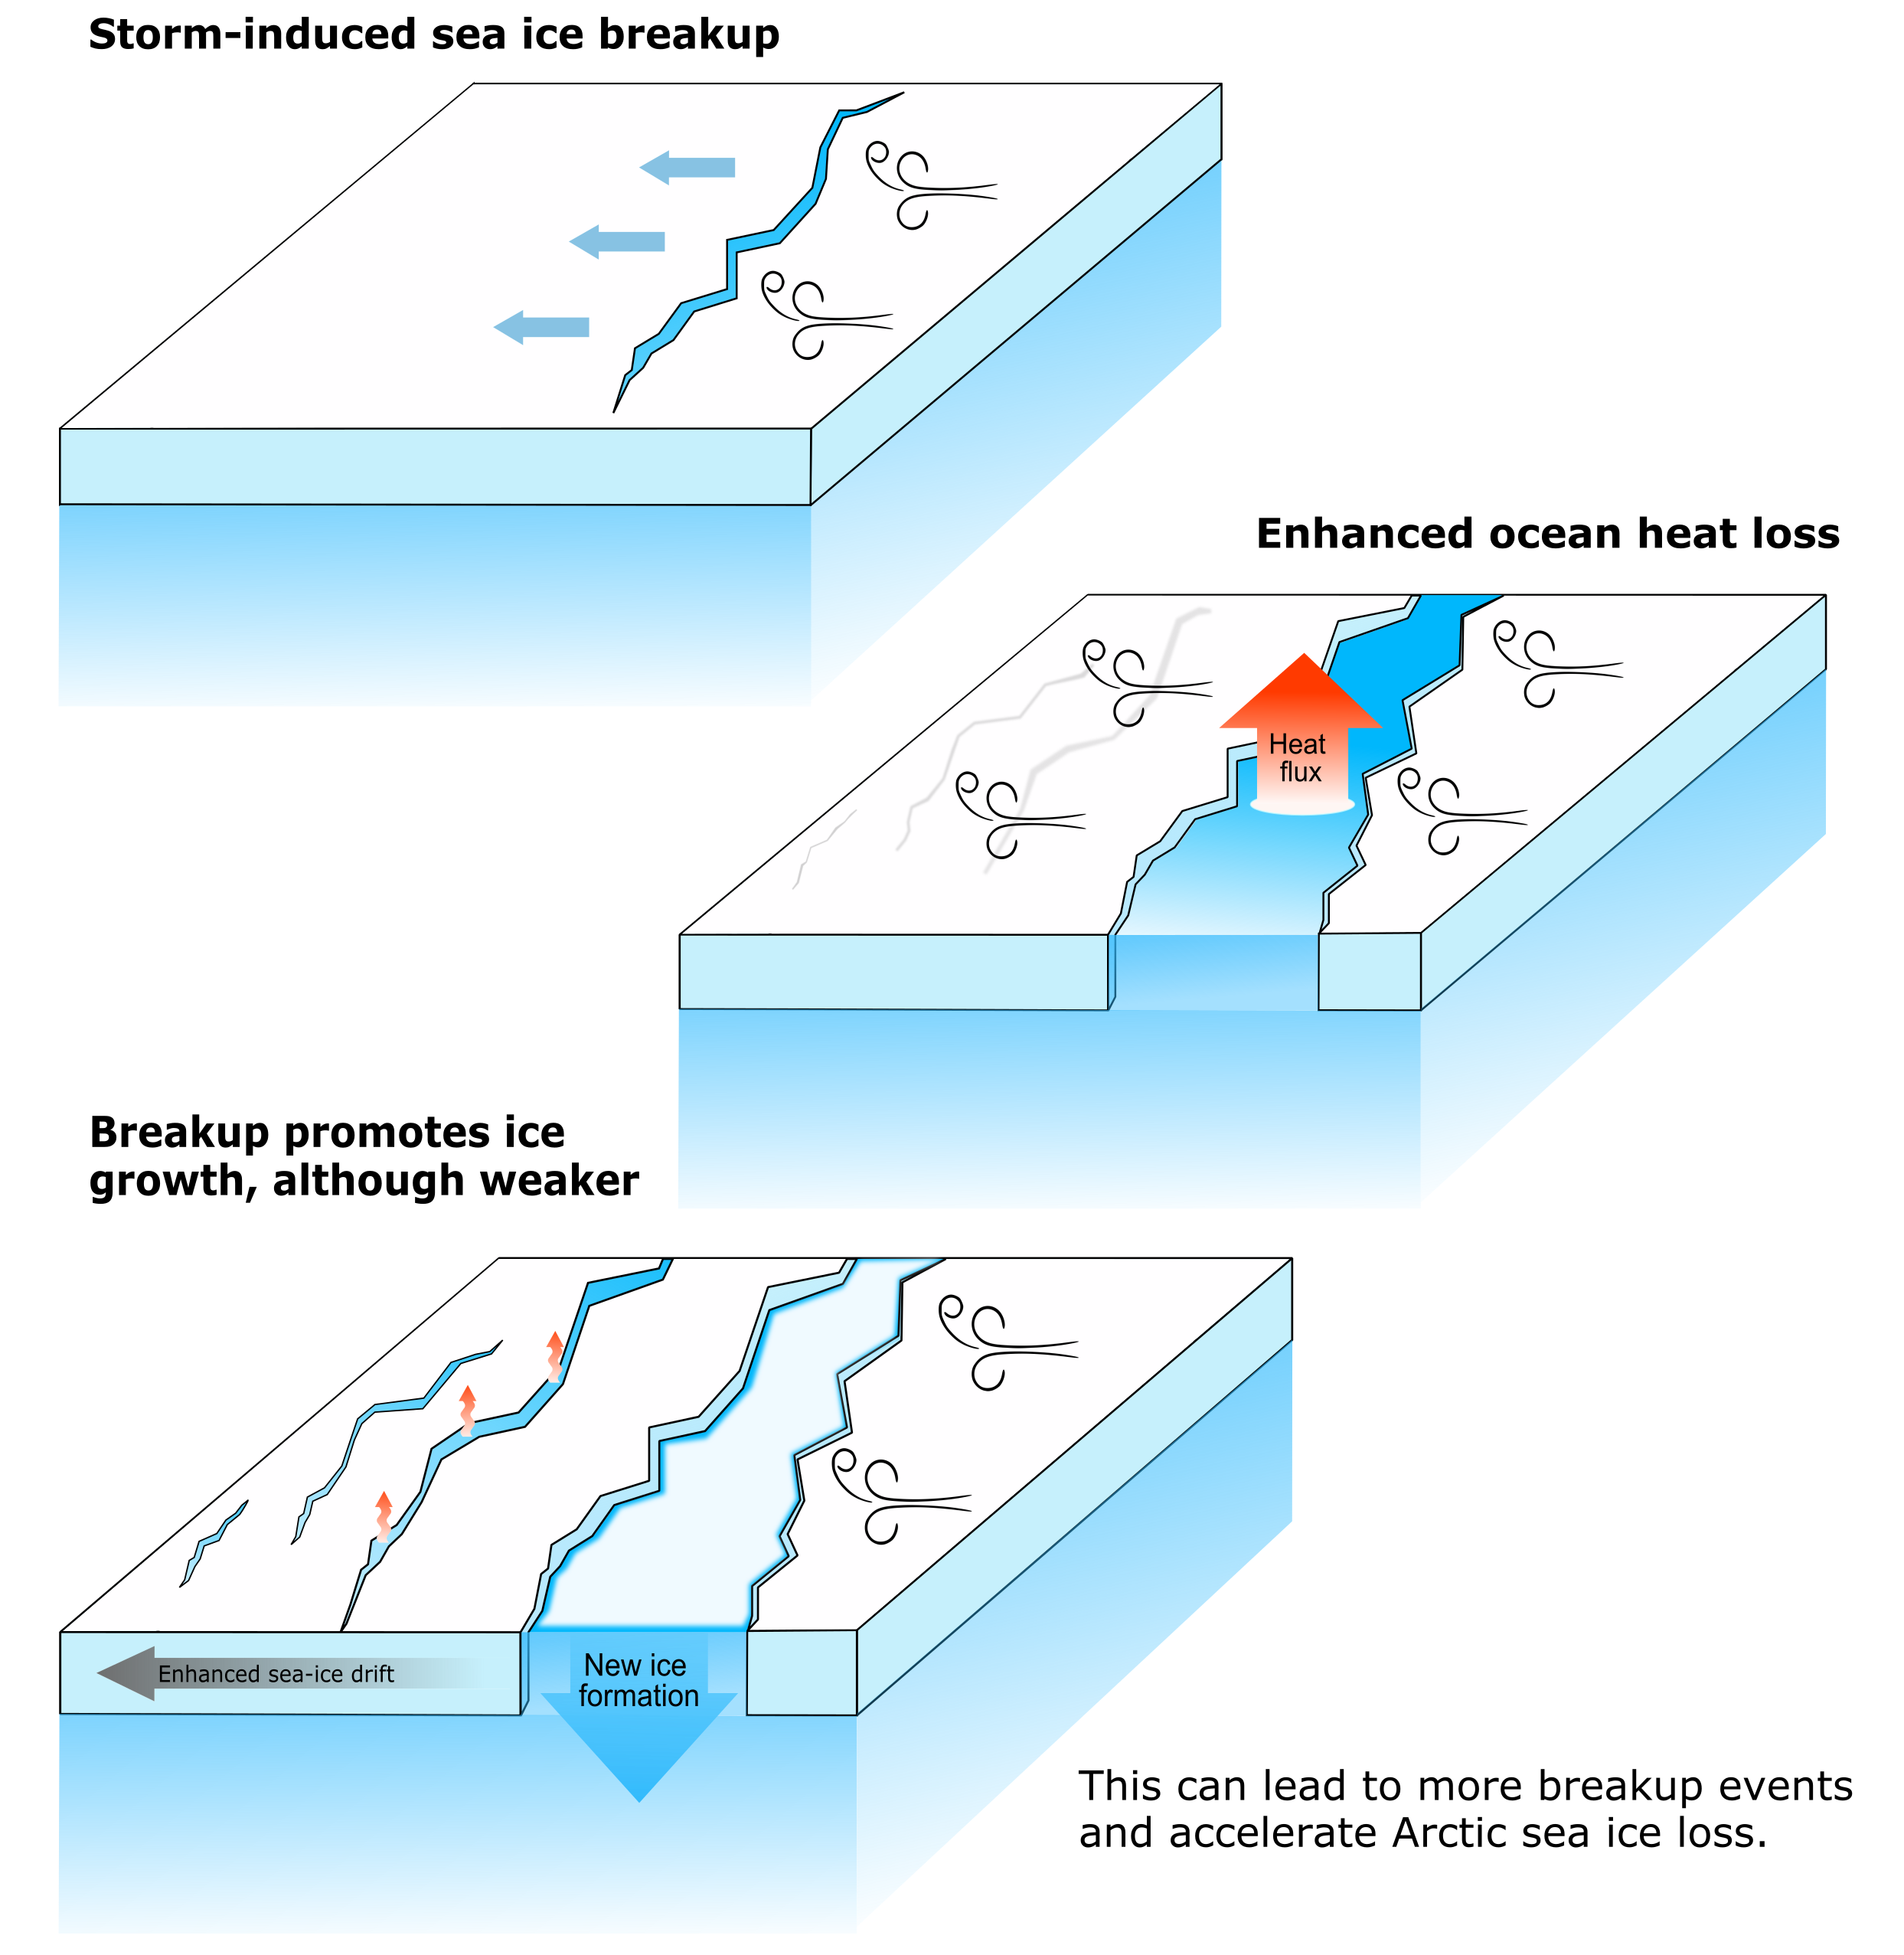
Although the process differs slightly depending on the season, the consequences of cracks opening are the same: the ice cover becomes thinner and further break-ups occur more easily.

Breakup illustration

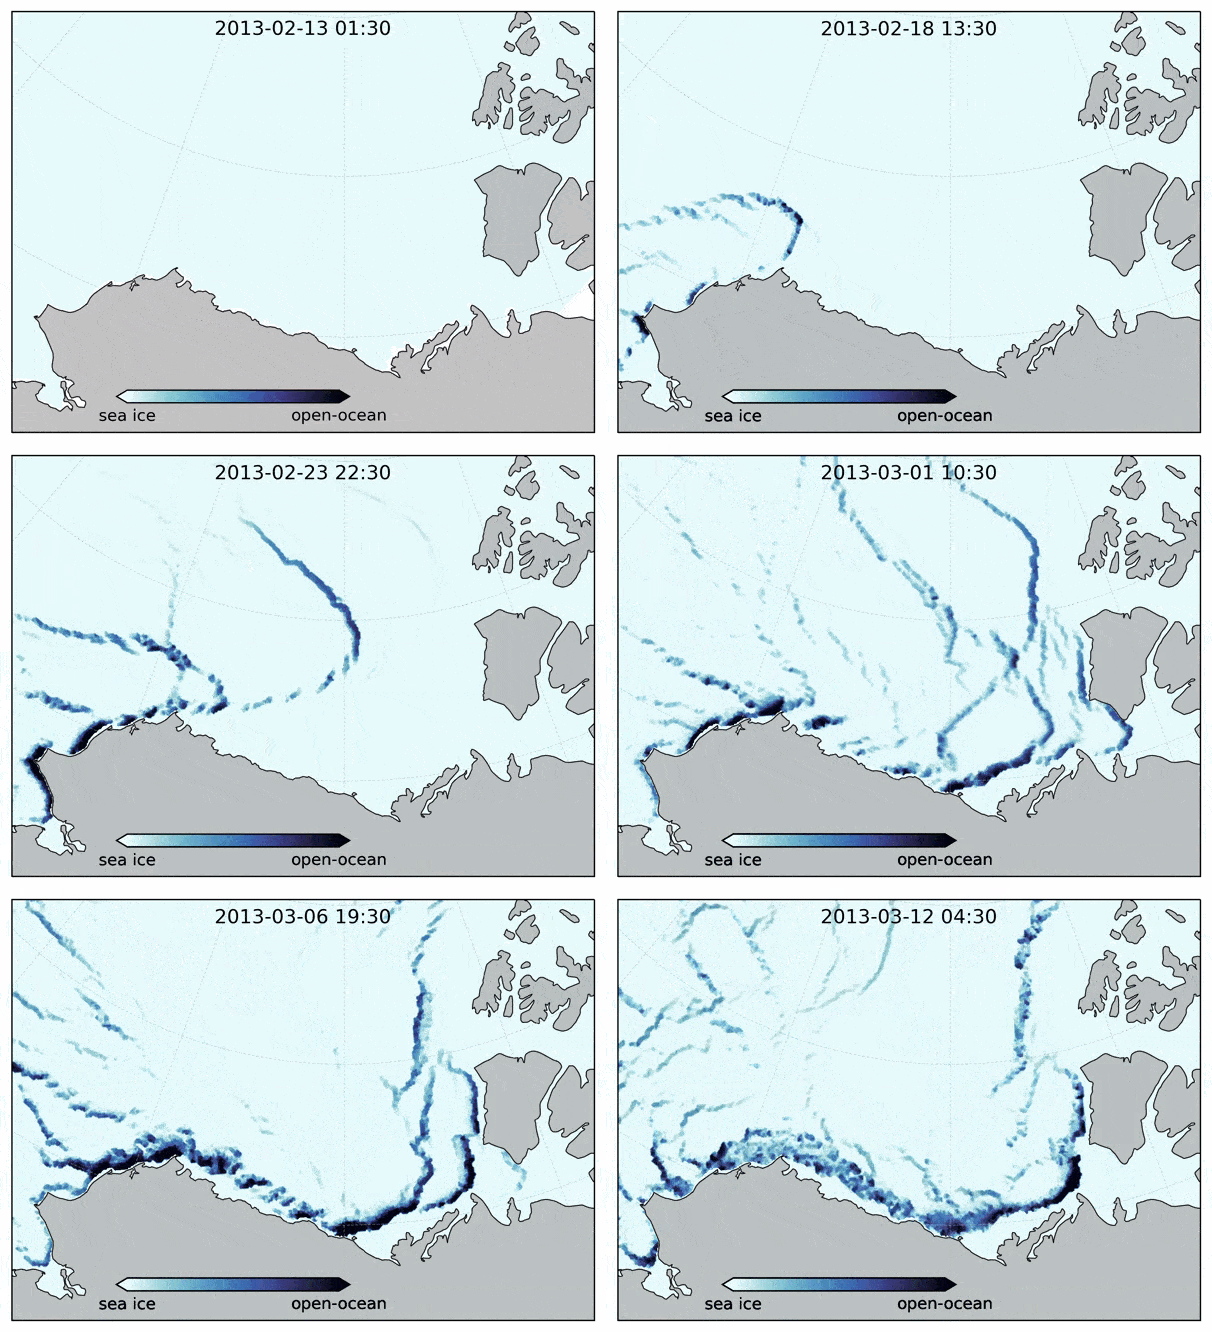
An example of this was seen in February 2013, when a large storm with strong winds hit the Beaufort Sea, opening up several leads which gradually grew into large cracks during the following days.

Today’s standard sea-ice models, such as those used in climate models, do not capture the details of a break-up. Researchers at NERSC, therefore, decided to apply their neXtSIM sea-ice model to the problem 4. Dubbed the next-generation sea-ice model, neXtSIM uses a different approach to modelling the physics of sea ice compared to the standard models. This new approach was inspired by a careful analysis of satellite remote sensing data. It would not have been conceived without those. In modelling break-ups, this new approach pays off — the model nicely captures all the salient details.

Scroll down to watch a simulation of the Beaufort storm.

neXtSIM simulation

neXtSIM simulation

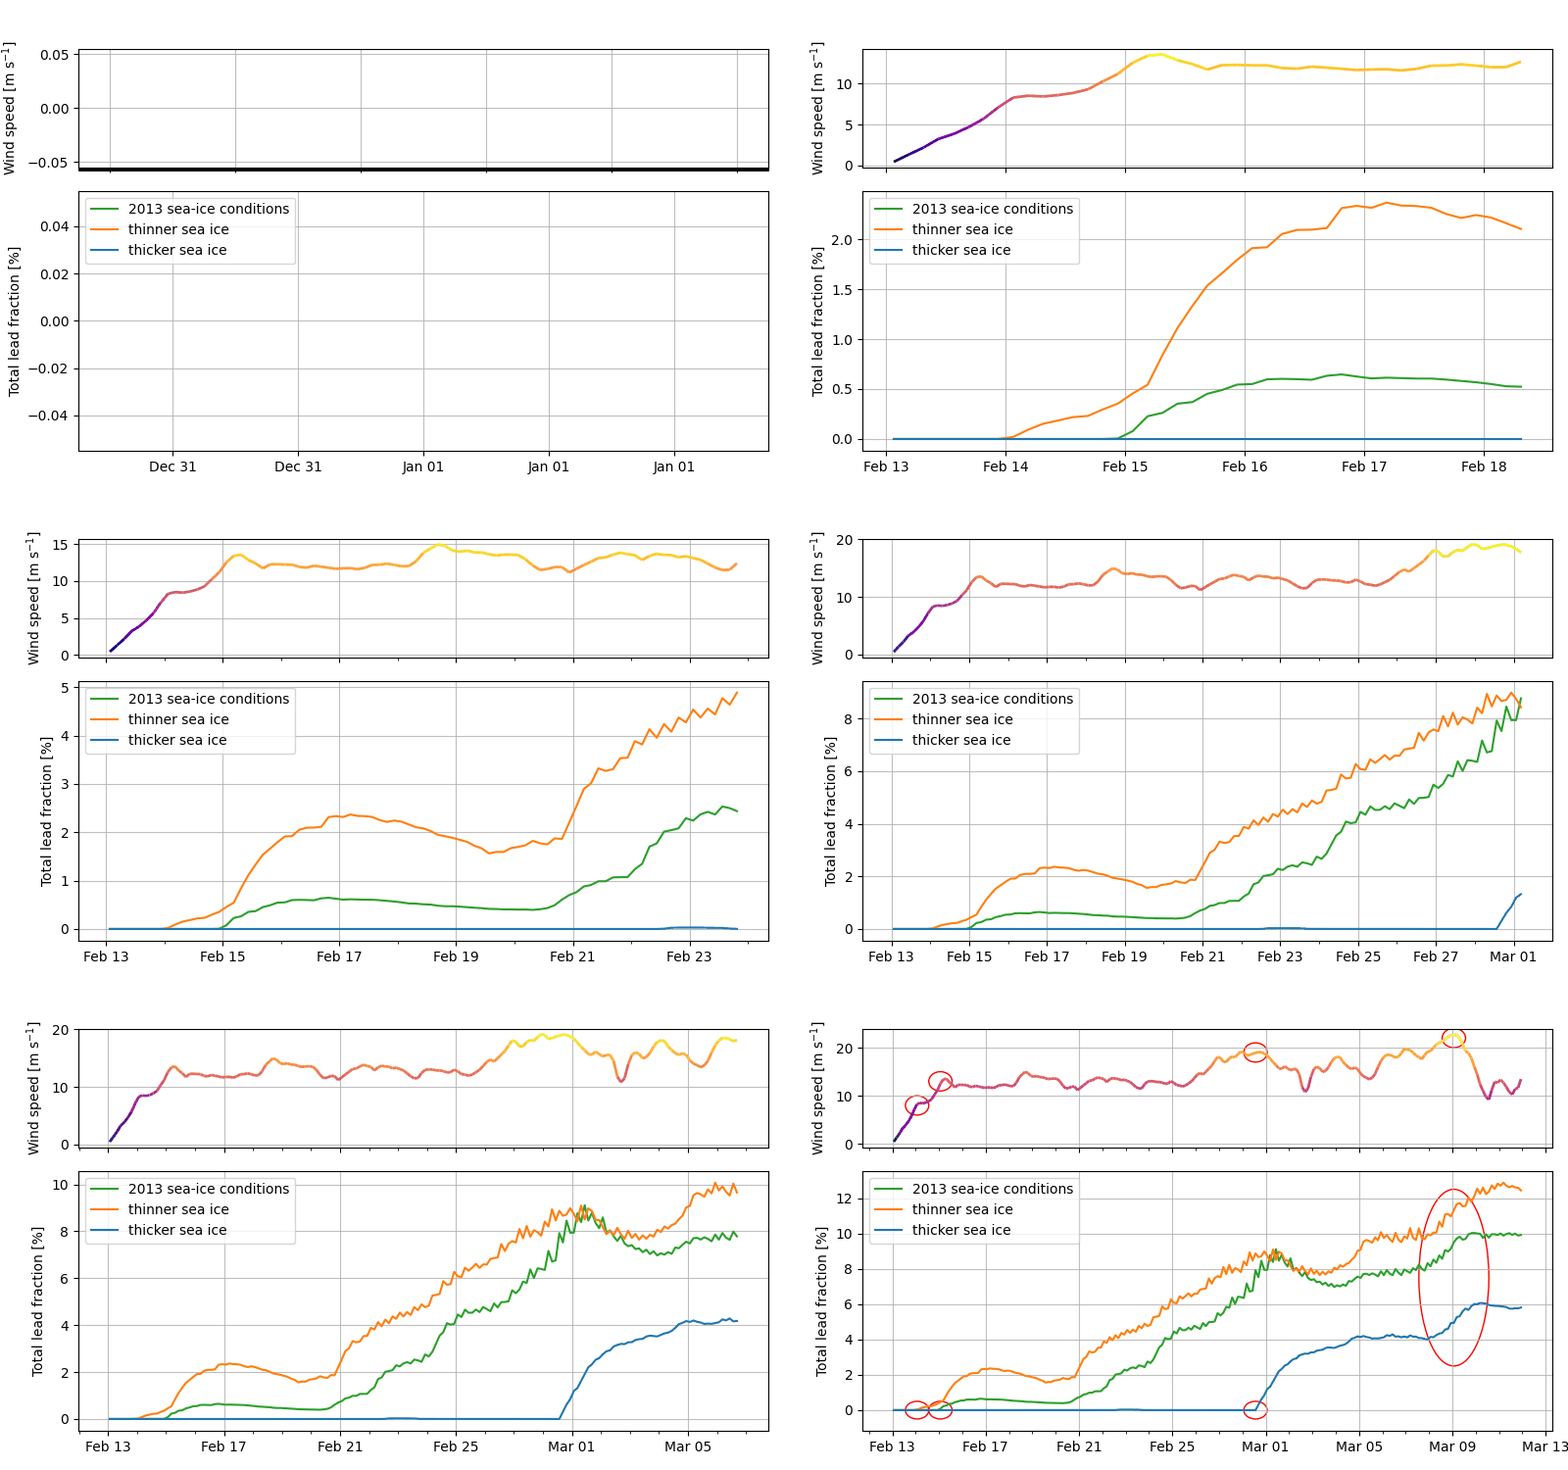
By studying these events, it has become clear that sea ice break-up is affected by changing ice thickness. Thin ice breaks more easily and at lower wind speeds.

This has important implications for the Arctic itself: as sea ice becomes thinner it is increasingly more vulnerable to storms, and extreme break-up events may become more frequent in the future.

We can see in the figure below how sustained high wind speeds open up cracks or enlarge the existing ones.

Sea ice thickness

We have seen many images of the implications that break-ups and sea ice decline have in the Arctic itself…

But the truth is that Arctic sea ice reduction has been identified as one of the 9 main global tipping points in climate change5, which are deeply interconnected.

Arctic sea ice loss may have an effect on the Atlantic Circulation, accelerated ice loss in Greenland and the thawing of Siberian permafrost. These, in turn, might have effects as far as the Amazon Forest, with an increased drought frequency.

The consequences of rapid sea ice decline go beyond local Arctic changes in air temperature, moisture, and cloud cover.

The effects on mid-latitudes could range from cold winters no longer being common during the period between 2050 and 2100, to altered summer precipitation patterns in Europe, the Mediterranean, and East Asia6.

To understand this better and be able to take appropriate action, research like the one being carried out within the Digital Twin projects is needed to promote the ability to perform numerical solutions with a high degree of realism.

Scroll down. Drag on the globe to rotate

About

The production of this interactive story has been possible thanks to the efforts of NERSC (Norway), Lobelia Earth (Spain) and under ESA funding. Data used for visualisation has been extracted from the Copernicus Marine Service MyOcean Viewer, and consists of historical Sea Ice Area Fraction with Product IDGLOBAL_REANALYSIS_PHY_001_030 published on the 26th August 2012 by Mercator Océan and Sea Ice Thickness with Product IDARCTIC_ANALYSISFORECAST_PHY_ICE_002_011, published on the 14th October 2016 by NERSC. The simulations of the break-up event in the Beaufort Sea has been provided by NERSC.

This story was produced in the context of European project Digital Twin Ocean Precursor.

References

1 Stroeve, J.C., Serreze, M.C., Holland, M.M. et al. (2012). The Arctic’s rapidly shrinking sea ice cover: a research synthesis. Climatic Change, 110, 1005–1027. DOI: 10.1007/s10584-011-0101-1.

2 Spreen, G., Kwok, R. & Menemenlis, D. (2011). Trends in Arctic sea ice drift and role of wind forcing: 1992-2009. Geophys. Res. Lett. 38. DOI: 10.1029/2011GL048970.

3 Screen, J. A., Simmonds, I. & Keay, K. (2011). Dramatic interannual changes of perennial Arctic sea ice linked to abnormal summer storm activity. J. Geophys. Res. 116, D15105. DOI: 10.1029/2011JD015847.

4 Williams, T., Korosov, A., Rampal, P., and Ólason, E. (2019). Presentation and evaluation of the Arctic sea ice forecasting system neXtSIM-F. The Cryosphere Discuss. (in review). DOI: 10.5194/tc-2019-154.

5 Lenton, T.M. et al. (2019). Climate tipping points — too risky to bet against. Nature. Nature Research. View PDF

6 Vihma, T. (2014). Effects of Arctic Sea Ice Decline on Weather and Climate: A Review. Surveys in Geophysics, 35(5), 1175–1214. DOI: 10.1007/s10712-014-9284-0.